Understand Australia
These stats predicts Sydney’s lockdown situation
The number of infections since the Delta variant was first identified in the eastern suburbs last month is approaching 2,000. Daily updates show figures in several key COVID indicators are climbing. Ms Berejiklian said she would be working hard over the weekend on a blueprint out of the crisis.
Some academics have built three different models that provide clues as to how long the lockdown in Sydney and its surrounds could need to run. They’re based on complex maths, and designed by separate teams from different institutions. The people behind these models argue they’re about as close to that as you can get, and history shows they’re pretty accurate.
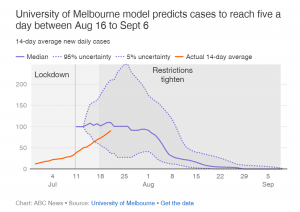

The first, from the University of Melbourne’s Populations Intervention Unit shows Sydney’s 14-day average number of new cases could be brought down to five by around August 28. The model predicts it could be as early as August 16 or as late as September 6 when variable factors are included in calculations. A 14-day average of less than five was the same trigger to relax restrictions that Victorian Premier Daniel Andrews used during Melbourne’s second wave last year.
Ms Berejiklian hasn’t publicly identified it as a significant number in her state’s lockdown calculations. The real-world data shows the actual 14-day average in NSW has been rising steadily and has not started to plateau. Tony Blakely, the epidemiologist who led the work, said the model was very accurate at predicting when Melbourne’s lockdown reached its goal.
Professor Blakely said the strength of the model was that it took the guess work out of calculating what the reproductive rate — the number of people each case infected — needed to be. The model has been tailored to Sydney and factors in the increased transmissibility of the Delta COVID-19 variant, which was not present during Melbourne’s second wave.
Another model, developed by the Burnett Institute of Medical Research, shows what have happened if restrictions similar to those brought in at the height of Melbourne’s second wave last year were introduced in Sydney on July 7.
The model, run in early July, predicted case numbers would be brought down to five in about a month. However, stronger restrictions were not introduced in Sydney until July 18, pushing the target out even further.
Margaret Hellard, the epidemiologist who led the work, said the model ascribed random attributes to every individual. She said the strength of the model was that it captured some of the random nature of the pandemic, but models were only one component and contact tracing and epidemiological data gathering were important to “paint the bigger picture of what’s going on”.
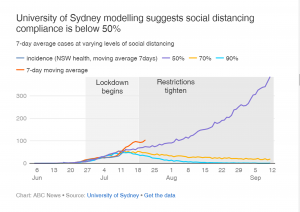

The third model, developed by the University of Sydney, is based around compliance. It shows case numbers could be brought down to less than five a day by August 13 if compliance in Greater Sydney increases to 90 per cent. Study author Sheryl Chang said to achieve 90 per cent compliance, Sydneysiders needed to reduce their activity to 10 per cent of normal. Dropping to 80 per cent compliance pushes the target out to August 28. The actual case numbers show compliance has been below 50 per cent since around July 12.
“More importantly, we really have to bring down the community interactions,” Dr Chang said. “Minimise your time outdoors, minimise the time you meet strangers. That’s how we can bring down the number of cases.” The model currently does not include actual movement data in Sydney.